
Most centers measure speed far more faithfully than resolution. In ICMI's 2025 survey, abandonment rate was measured by 85% and average handle time by 84%, while deflection rate was measured by only 14% and self-service accessibility by only 13%, according to ICMI's 2025 overview of what contact centers are measuring. That gap explains why a dashboard can look efficient while customers still repeat themselves on another channel.
A contact center metric is useful only when its formula, segment, measurement window, and business outcome are clear. Without those rules, you're not benchmarking performance. You're comparing definitions.
This guide covers ten essential KPIs as linked decisions, not isolated targets. Operational metrics explain capacity and access, customer metrics explain whether the work helped, quality metrics explain whether it was done correctly, and workforce metrics explain whether performance is sustainable. Each metric below includes its companion checks, because optimizing one KPI alone is the fastest way to make apparently strong performance misleading.
For BPO scorecards, that distinction matters even more. A vendor can hit a black-box target by changing exclusions, sampling rules, or closure behavior. A buyer who specifies the calculation, data source, and segmentation in advance gets a scorecard that supports diagnosis, coaching, and fair commercial decisions instead of monthly disputes about whose number is right.
Table of Contents
- 1. First Contact Resolution (FCR)
- 2. Average Handle Time (AHT)
- 3. Customer Satisfaction Score (CSAT)
- 4. Net Promoter Score (NPS)
- 5. Customer Effort Score (CES)
- 6. Service Level
- 7. Average Speed of Answer (ASA)
- 8. Abandonment Rate
- 9. Quality Assurance (QA) Score
- 10. Agent Attrition Rate
- Comparison of 10 Key Contact Center Metrics
- Build a Scorecard That Drives Better Decisions
1. First Contact Resolution (FCR)

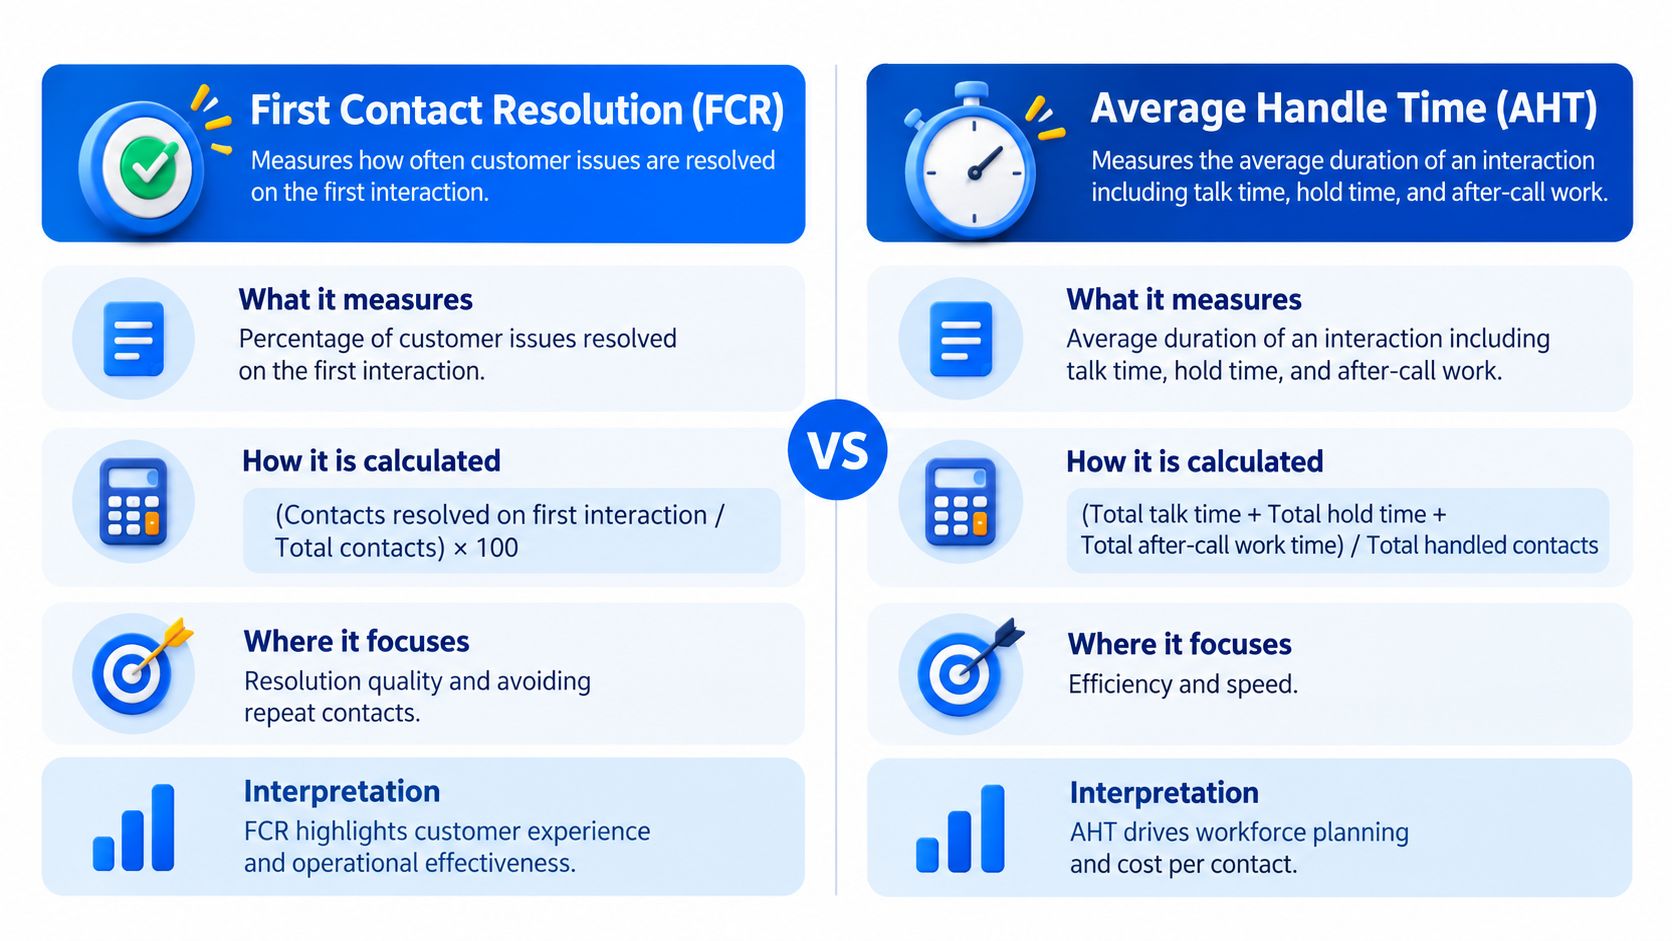
First Contact Resolution measures the share of issues resolved during the first interaction, without a follow-up contact or transfer. It's foundational because it reflects knowledge management, process design, system access, routing, and agent authority at once. SQM Group research cited in AltiGen's overview of call center performance metrics places the average FCR rate at approximately 70% to 71%, with 80% or higher as the world-class benchmark reached by only about 5% of contact centers.
That context changes interpretation. A center at 75% is above the commonly cited average, not mediocre. It also means a vendor promising dramatic gains should explain which constraint will change, such as refund authority or system access, not just agent effort.
How to Measure It Without Inflating It
Define resolution before setting a target. Validate a post-contact survey answer against repeat-contact analysis using the same customer and issue identifier, and set one consistent window.
- Segment by issue: Billing corrections and complex technical faults shouldn't share one target.
- Review failures weekly: A telecom team can link repeat billing contacts to missing account views, while a support BPO can trace repeats to absent knowledge articles.
- Contract the method: In BPO agreements, specify the measurement method, repeat window, transfer rule, and data source.
Pair FCR with transfer rate, repeat contacts, and CSAT. If FCR rises while transfers fall outside the definition, you haven't improved resolution. You've reclassified it.
2. Average Handle Time (AHT)
A financial services team cuts after-call work with auto-summarization and its Average Handle Time falls. That's useful only if resolution and quality hold. If agents shorten conversations and customers call back, the center has moved cost, not removed it.
AHT equals talk time plus hold time plus after-call work, divided by handled contacts. It's essential for workforce planning, staffing models, and cost forecasting, but it's the easiest metric to misread. Lower AHT can signal faster resolution, premature transfers, failed self-service, or customers repeating their issue elsewhere.
AI makes that ambiguity sharper. In the 2025 ICMI survey cited in Forrester's future of AI-powered CX research, 54% of centers reported some AI functionality, but only 6% classified their capabilities as advanced. Adoption alone therefore tells you little about whether handle time fell for the right reason.
Practical rule: Never reward a lower AHT unless FCR, QA, and repeat-contact rate move in a compatible direction.
Track AHT by contact reason, language, and complexity rather than relying on one blended average. Add median and percentile views so a small set of very long cases doesn't hide the typical experience. An outsourced operation that segments AHT often discovers its average is masking complex cases that need a separate escalation path, not pressure on every agent to talk faster.
3. Customer Satisfaction Score (CSAT)
Customer Satisfaction Score asks customers to rate a specific interaction, commonly on a 1 to 5 scale, and is usually reported as the share selecting a positive rating. Because it's transactional, CSAT gives fast feedback you can link to a queue, journey, agent group, or process change.
Its weakness is sampling. If surveys go mainly to simple contacts, happy customers, or one channel, the score describes your sampling design more than your operation.
A retail center that adds a short SMS survey with one open-text follow-up can surface product defects for merchandising teams, not just agent coaching points. That verbatim layer is where CSAT becomes diagnostic. It tells you whether low scores came from waiting, policy, explanation quality, or a product fault the agent couldn't fix.
Controls That Make CSAT Comparable
- Keep it short: One or two questions protect response rates.
- Standardize wording: Multi-vendor programs need the same scale and timing.
- Don't judge agents on CSAT alone: Combine it with QA and FCR.
Buyers comparing providers listed among companies that outsource customer service should ask for response denominators and segment coverage. A high score with narrow sampling isn't evidence of better service. It's evidence of a narrower question.
4. Net Promoter Score (NPS)
Don't use Net Promoter Score to coach yesterday's calls. NPS asks how likely a customer is to recommend the company on a 0 to 10 scale, then subtracts the share of Detractors (0 to 6) from Promoters (9 to 10), with Passives at 7 to 8. That makes it a relationship measure, shaped by product, price, policy, and service together.
Its value in a contact center scorecard is directional and commercial. Research covering more than 23,000 consumers in Qualtrics' contact center trends analysis found customers are 2.1 times more likely to recommend a brand when their issue is resolved during the first interaction. Resolution therefore connects an operational decision to advocacy in a way a speed target can't.
A telecom operator using NPS driver analysis might find that clear explanations matter more than shaving seconds from queue time. That finding should change coaching and knowledge design, not trigger a generic loyalty campaign.
Use verbatim comments by theme, close the loop with detractors promptly, and keep timing and wording consistent across vendors. Avoid tying individual agent pay solely to NPS, since agents don't control network outages, pricing, or product defects. Use CSAT or CES for transactional improvement, and reserve NPS for whether repeated service experiences are strengthening or weakening the relationship over time.
5. Customer Effort Score (CES)
A customer can be satisfied with a friendly agent and still have worked too hard. Customer Effort Score captures that difference by asking whether the company made it easy to handle the issue, typically on a short agreement scale. It's especially useful after billing disputes, account changes, order problems, and technical help.
Where Effort Usually Hides
Effort rarely comes from one rude interaction. It accumulates through transfers, repeated authentication, channel switching, confusing IVR menus, and policy explanations customers have to decode themselves.
- Transfer rate: Each handoff forces repetition and creates a new failure point.
- Repeat authentication: A utility that carries verified status across transfers removes friction agents can't talk their way around.
- Self-service design: An airline that improves rebooking flows reduces high-effort disruption calls before they reach the queue.
Pair CES with journey maps. If effort spikes after a specific IVR branch or identity check, you've found a structural fix for product or operations teams, not a coaching topic. Share those findings beyond the contact center.
CES also disciplines AI claims. Containment isn't success if customers escape the bot exhausted and then call. Measure effort after digital journeys, segment by completion path, and compare customers who needed human help with those who didn't. Low effort with verified resolution is the goal. Low agent contact alone isn't.
6. Service Level
The familiar 80/20 target means 80% of calls answered within 20 seconds. It's useful shorthand, but it isn't a law of nature. According to Stealth Agents' summary of average speed of answer statistics, a 2025 benchmark cited 58% of contact centers using 80/20 as their primary phone service-level target, while 34% had changed their target within the preceding three years.
That movement matters. Customer expectations, call complexity, geography, channel mix, and abandonment behavior can make a different threshold economically rational. A sales queue, an urgent healthcare line, and a routine account queue shouldn't automatically share one standard.
This short video explains service level in operational terms before you set targets by queue.
Set service level by channel and queue, monitor it in short intervals, and define how abandoned calls, short calls, callbacks, and exceptional events are treated. A healthcare provider can use interval alerts to move agents from back-office work at peaks. A banking BPO can vary targets by hour and call type so cost follows demand.
Always read service level with abandonment, ASA, occupancy, and satisfaction. Hitting the threshold by rushing answers can increase transfers and repeat contacts, which makes access look better while resolution gets worse.
7. Average Speed of Answer (ASA)
Average Speed of Answer is the average time customers wait in queue before an agent answers. Service level tells you whether you met a threshold. ASA tells you what the typical wait felt like, and when reported with maximum wait, it reveals the customers your threshold left behind.
Averages still hide patterns. A multi-site center might find ASA is acceptable all week except Monday mornings in one region. The fix isn't more staff everywhere. It's shifting start times, cross-training a skill group, or offering callback at the predictable peak.
A good overall ASA can coexist with a failing queue. If you don't segment by skill group, you're managing the blend, not the customer's actual line.
Report ASA by hour, day, queue, and skill group. Compare forecast demand with actual arrivals so planners can see whether long waits came from understaffing, schedule adherence, AHT variance, or unexpected volume. That diagnostic step prevents the common error of blaming agents for a capacity problem.
Virtual callback and virtual hold change interpretation too. They can reduce perceived waiting and abandonment without changing the time until resolution begins. Track callback acceptance, callback completion, and time to live conversation separately. Otherwise ASA may improve on paper while customers still wait just as long for help, only away from the phone queue.
8. Abandonment Rate
Abandonment Rate measures customers who end contact before reaching an agent. It's a clear access signal, but only if you split it. Short abandons and long abandons point to different causes and different owners.
A bank that separates the two might discover most short abandons happen during IVR authentication. That's not a staffing problem. It's a design problem in the login flow. Long abandons, by contrast, usually indicate queue time beyond customer tolerance or a callback offer that arrives too late.
A Diagnostic Sequence
First, define the short-abandon threshold in writing and apply it consistently across sites and vendors. Second, map abandonment to the exact IVR path, queue, and interval. Third, check what abandoners do next, including repeat calls, digital contacts, complaints, or lost transactions.
An e-commerce team can offer callback during predictable peaks and reduce long abandons without adding permanent staff. The center should still verify that callbacks happen when promised. A missed callback converts an access failure into a trust failure.
Align abandonment targets with service level and ASA in SLAs, and state exclusions explicitly. If short abandons are removed by one vendor and included by another, you're not comparing access. You're comparing reporting choices. Consistent definitions turn abandonment from a blame metric into a guide for IVR, staffing, and callback decisions.
9. Quality Assurance (QA) Score

A Quality Assurance Score evaluates interactions against a defined scorecard covering compliance, process adherence, communication, empathy, product knowledge, and resolution accuracy. In regulated work, it's a risk control. In every operation, it's the main bridge between observed behavior and coaching.
That bridge fails when reviewers score differently. A financial services BPO that runs calibration sessions between client teams and QA reviewers reduces variance and makes scores defensible. Without calibration, agents learn which reviewer they have, not which behavior matters.
Keep the scorecard focused on behaviors that affect outcomes and compliance. Long checklists create precise-looking scores that predict little. Use risk-based sampling so disclosures, vulnerable customers, complaints, and high-value transactions get more review than routine contacts.
Speech analytics can flag compliance phrases for human review, but automation doesn't remove the need for judgment on accuracy and empathy. Buyers evaluating customer support centers should ask how sampling, calibration, appeals, and coaching closure work in practice.
Validate QA against CSAT, CES, and FCR. If QA rises while customers report more effort and repeat contacts increase, your scorecard is rewarding internal form over customer outcome. Redesign it around the behaviors that produce correct, complete resolution.
10. Agent Attrition Rate
Agent Attrition Rate measures the share of agents who leave over a defined period. Report it by tenure, voluntary and involuntary exit, team, shift, and early attrition in the first stage of employment. Each cut identifies a different management problem.
Early attrition usually points to hiring fit, training realism, schedule shock, or weak onboarding. A BPO that adds onboarding buddies and a structured development plan for new hires is treating that signal correctly. Attrition among experienced high performers points elsewhere, often to pay progression, schedule flexibility, supervisor quality, or the absence of a credible next role.
- Track early exits separately: They expose selection and onboarding failures quickly.
- Combine exit interviews with pulse surveys: Don't wait until resignation to learn about fixable friction.
- Build visible paths: Quality coach, subject expert, and team lead roles give strong agents a reason to stay.
Attrition belongs on the executive scorecard because it predicts tomorrow's QA, FCR, and AHT. Newer teams usually need more support, escalate more often, and take longer to reach proficiency. A center can therefore hit this month's cost target by accepting churn and create next quarter's quality problem.
In outsourcing contracts, require transparent attrition reporting by cohort and tenure. A single blended rate lets a vendor hide early losses behind a stable senior core, even while training capacity and service consistency deteriorate.
Comparison of 10 Key Contact Center Metrics
| Metric | Measurement / Focus | 🔄 Implementation Complexity & Resources | 📊 Expected Outcomes | ⭐ Ideal Use & Key Advantage |
|---|---|---|---|---|
| First Contact Resolution (FCR) | Issues resolved during the first interaction | Moderate; requires clear resolution rules and repeat-contact tracking | Fewer repeat contacts and lower operating costs | Identify resolution gaps; links customer experience with efficiency |
| Average Handle Time (AHT) | Talk, hold, and after-contact work per interaction | Low; typically available in contact-center platforms | Supports staffing and cost forecasting | Capacity planning; ⚡ highlights handling inefficiencies |
| Customer Satisfaction Score (CSAT) | Customer rating of a specific interaction | Low to moderate; requires surveys and representative responses | Tracks interaction-level satisfaction | Agent and process coaching; 💡 provides direct customer feedback |
| Net Promoter Score (NPS) | Likelihood to recommend; promoters minus detractors | Moderate; requires periodic surveys and response analysis | Indicates relationship-level loyalty trends | Strategic loyalty tracking; easy to communicate to executives |
| Customer Effort Score (CES) | Perceived ease of completing a task or resolving an issue | Moderate; requires journey-focused surveys and analysis | Reveals friction and opportunities to simplify service | Journey and self-service improvements; focuses on customer effort |
| Service Level | Contacts answered within a defined time threshold | Moderate; requires queue data, forecasting, and staffing plans | Shows whether access targets are being met | Real-time capacity management; clear operational SLA measure |
| Average Speed of Answer (ASA) | Average queue wait for answered contacts | Low; requires queue-time reporting by interval and queue | Shows average wait and staffing gaps | Monitor customer access; ⚡ easy to understand and trend |
| Abandonment Rate | Contacts ended before reaching an agent | Low; requires consistent queue and short-abandon definitions | Highlights access problems and potential lost contacts | Improve staffing, IVR, or callback options; identifies unmet demand |
| Quality Assurance (QA) Score | Interaction performance against a quality scorecard | Moderate to high; requires scorecards, reviewers, and calibration | Supports coaching, service consistency, and compliance | Quality control, especially in regulated operations; identifies behavior gaps |
| Agent Attrition Rate | Agents leaving during a defined period | Moderate; requires workforce and exit data | Informs hiring needs and workforce stability | Workforce planning; signals retention and employee-experience issues |
Build a Scorecard That Drives Better Decisions
The strongest scorecard starts with outcomes, not dashboard tiles. Decide which customer and business results you're trying to improve, then choose the small set of metrics that explains whether those results happened and why. For most operations, that means linking FCR, CSAT or CES, service level, abandonment, QA, AHT, and attrition in one review, with NPS as the slower relationship check. Each metric needs a named owner who can change staffing, process, knowledge, routing, coaching, or policy when variance appears.
Document every calculation rule before you set targets. Write down the formula, data source, included channels, measurement window, exclusions, sampling method, and transfer treatment. This sounds administrative, but it's where benchmark comparisons succeed or fail. Two centers can report the same FCR label while one uses survey responses and the other uses repeat-contact analysis. Two vendors can report service level while treating short abandons differently. Without shared rules, ranking them is false precision.
Segment relentlessly. Report by channel, issue type, queue, customer value, language, complexity, and vendor site. Blended averages conceal the exact pockets where customers wait longest, repeat contact most often, or receive incorrect answers. Segmentation also protects agents from unfair targets. A complex technical queue shouldn't be managed to the AHT of a password queue, and a new-hire cohort shouldn't be judged as if it had the same proficiency as tenured specialists.
Pair every efficiency metric with a guardrail. AHT needs FCR and QA. Service level needs abandonment and repeat contacts. AI containment needs verified resolution, escalation reasons, customer effort, and subsequent repeat contact. QA needs customer outcomes so internal checklists don't drift away from what customers value. When a primary metric improves and its guardrail worsens, treat that as a warning to investigate, not a success to celebrate.
For outsourced operations, build the BPO scorecard around transparency rather than black-box targets. Require vendors to show calculation methods, provide access to underlying interaction and survey data where contractually appropriate, and explain variance by segment. Put definitions, reporting intervals, audit rights, calibration routines, and corrective-action expectations in the agreement. Tie incentives to linked outcomes, not one easily gamed number. A bonus for lower AHT alone invites shorter calls. A balanced incentive tied to resolution, quality, access, and retention invites better operations.
Review the scorecard on a regular cycle. Remove metrics that don't influence a decision, retire targets inherited from a different channel mix, and add measures when work changes, especially as AI handles more self-service or agent-assist tasks. If it fits your evaluation process, AnyBPO is one relevant option for vendor-neutral support in comparing providers and structuring performance expectations. Whether you use an adviser or run the process internally, the principle stays the same. Measure the work customers experienced, make the rules visible, and assign a corrective action to every material variance.
If you're rebuilding your contact center scorecard or comparing BPO providers, AnyBPO can help you define comparable metrics, vet providers against consistent evidence, and match your requirements to partners across markets. Visit the site to start a structured evaluation based on resolution, quality, access, and workforce sustainability, not headline targets alone.